Download FCSS-Security Operations 7.4 Analyst.FCSS_SOC_AN-7.4.VCEplus.2025-03-10.18q.vcex
| Vendor: | Fortinet |
| Exam Code: | FCSS_SOC_AN-7.4 |
| Exam Name: | FCSS-Security Operations 7.4 Analyst |
| Date: | Mar 10, 2025 |
| File Size: | 2 MB |
| Downloads: | 1 |
How to open VCEX files?
Files with VCEX extension can be opened by ProfExam Simulator.
Discount: 20%

Demo Questions
Question 1
Which FortiAnalyzer connector can you use to run automation stitches9
- FortiCASB
- FortiMail
- Local
- FortiOS
Correct answer: D
Explanation:
Overview of Automation Stitches:Automation stitches in FortiAnalyzer are predefined sets of automated actions triggered by specific events. These actions help in automating responses to security incidents, improving efficiency, and reducing the response time.FortiAnalyzer Connectors:FortiAnalyzer integrates with various Fortinet products and other third-party solutions through connectors. These connectors facilitate communication and data exchange, enabling centralized management and automation.Available Connectors for Automation Stitches:FortiCASB: FortiCASB is a Cloud Access Security Broker that helps secure SaaS applications. However, it is not typically used for running automation stitches within FortiAnalyzer.FortiMail:FortiMail is an email security solution. While it can send logs and events to FortiAnalyzer, it is not primarily used for running automation stitches.Local:The local connector refers to FortiAnalyzer's ability to handle logs and events generated by itself. This is useful for internal processes but not specifically for integrating with other Fortinet devices for automation stitches.FortiOS:FortiOS is the operating system that runs on FortiGate firewalls. FortiAnalyzer can use the FortiOS connector to communicate with FortiGate devices and run automation stitches. This allows FortiAnalyzer to send commands to FortiGate, triggering predefined actions in response to specific events.Detailed Process:Step 1: Configure the FortiOS connector in FortiAnalyzer to establish communication with FortiGate devices.Step 2: Define automation stitches within FortiAnalyzer that specify the actions to be taken when certain events occur.Step 3: When a triggering event is detected, FortiAnalyzer uses the FortiOS connector to send the necessary commands to the FortiGate device.Step 4: FortiGate executes the commands, performing the predefined actions such as blocking an IP address, updating firewall rules, or sending alerts.Conclusion:The FortiOS connector is specifically designed for integration with FortiGate devices, enabling FortiAnalyzer to execute automation stitches effectively.Fortinet FortiOS Administration Guide: Details on configuring and using automation stitches.Fortinet FortiAnalyzer Administration Guide: Information on connectors and integration options.By utilizing the FortiOS connector, FortiAnalyzer can run automation stitches to enhance the security posture and response capabilities within a network. Overview of Automation Stitches:
Automation stitches in FortiAnalyzer are predefined sets of automated actions triggered by specific events. These actions help in automating responses to security incidents, improving efficiency, and reducing the response time.
FortiAnalyzer Connectors:
FortiAnalyzer integrates with various Fortinet products and other third-party solutions through connectors. These connectors facilitate communication and data exchange, enabling centralized management and automation.
Available Connectors for Automation Stitches:
FortiCASB:
FortiCASB is a Cloud Access Security Broker that helps secure SaaS applications. However, it is not typically used for running automation stitches within FortiAnalyzer.
FortiMail:
FortiMail is an email security solution. While it can send logs and events to FortiAnalyzer, it is not primarily used for running automation stitches.
Local:
The local connector refers to FortiAnalyzer's ability to handle logs and events generated by itself. This is useful for internal processes but not specifically for integrating with other Fortinet devices for automation stitches.
FortiOS:
FortiOS is the operating system that runs on FortiGate firewalls. FortiAnalyzer can use the FortiOS connector to communicate with FortiGate devices and run automation stitches. This allows FortiAnalyzer to send commands to FortiGate, triggering predefined actions in response to specific events.
Detailed Process:
Step 1: Configure the FortiOS connector in FortiAnalyzer to establish communication with FortiGate devices.
Step 2: Define automation stitches within FortiAnalyzer that specify the actions to be taken when certain events occur.
Step 3: When a triggering event is detected, FortiAnalyzer uses the FortiOS connector to send the necessary commands to the FortiGate device.
Step 4: FortiGate executes the commands, performing the predefined actions such as blocking an IP address, updating firewall rules, or sending alerts.
Conclusion:
The FortiOS connector is specifically designed for integration with FortiGate devices, enabling FortiAnalyzer to execute automation stitches effectively.
Fortinet FortiOS Administration Guide: Details on configuring and using automation stitches.
Fortinet FortiAnalyzer Administration Guide: Information on connectors and integration options.
By utilizing the FortiOS connector, FortiAnalyzer can run automation stitches to enhance the security posture and response capabilities within a network.
Question 2
Refer to the exhibits.

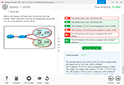
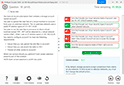
What can you conclude from analyzing the data using the threat hunting module?
- Spearphishing is being used to elicit sensitive information.
- DNS tunneling is being used to extract confidential data from the local network.
- Reconnaissance is being used to gather victim identity information from the mail server.
- FTP is being used as command-and-control (C&C) technique to mine for data.
Correct answer: B
Explanation:
Understanding the Threat Hunting Data:The Threat Hunting Monitor in the provided exhibits shows various application services, their usage counts, and data metrics such as sent bytes, average sent bytes, and maximum sent bytes.The second part of the exhibit lists connection attempts from a specific source IP (10.0.1.10) to a destination IP (8.8.8.8), with repeated 'Connection Failed' messages.Analyzing the Application Services:DNS is the top application service with a significantly high count (251,400) and notable sent bytes (9.1 MB).This large volume of DNS traffic is unusual for regular DNS queries and can indicate the presence of DNS tunneling.DNS Tunneling:DNS tunneling is a technique used by attackers to bypass security controls by encoding data within DNS queries and responses. This allows them to extract data from the local network without detection.The high volume of DNS traffic, combined with the detailed metrics, suggests that DNS tunneling might be in use.Connection Failures to 8.8.8.8:The repeated connection attempts from the source IP (10.0.1.10) to the destination IP (8.8.8.8) with connection failures can indicate an attempt to communicate with an external server.Google DNS (8.8.8.8) is often used for DNS tunneling due to its reliability and global reach.Conclusion:Given the significant DNS traffic and the nature of the connection attempts, it is reasonable to conclude that DNS tunneling is being used to extract confidential data from the local network.Why Other Options are Less Likely:Spearphishing (A): There is no evidence from the provided data that points to spearphishing attempts, such as email logs or phishing indicators.Reconnaissance (C): The data does not indicate typical reconnaissance activities, such as scanning or probing mail servers.FTP C&C (D): There is no evidence of FTP traffic or command-and-control communications using FTP in the provided data.SANS Institute: 'DNS Tunneling: How to Detect Data Exfiltration and Tunneling Through DNS Queries' SANS DNS TunnelingOWASP: 'DNS Tunneling' OWASP DNS TunnelingBy analyzing the provided threat hunting data, it is evident that DNS tunneling is being used to exfiltrate data, indicating a sophisticated method of extracting confidential information from the network. Understanding the Threat Hunting Data:
The Threat Hunting Monitor in the provided exhibits shows various application services, their usage counts, and data metrics such as sent bytes, average sent bytes, and maximum sent bytes.
The second part of the exhibit lists connection attempts from a specific source IP (10.0.1.10) to a destination IP (8.8.8.8), with repeated 'Connection Failed' messages.
Analyzing the Application Services:
DNS is the top application service with a significantly high count (251,400) and notable sent bytes (9.1 MB).
This large volume of DNS traffic is unusual for regular DNS queries and can indicate the presence of DNS tunneling.
DNS Tunneling:
DNS tunneling is a technique used by attackers to bypass security controls by encoding data within DNS queries and responses. This allows them to extract data from the local network without detection.
The high volume of DNS traffic, combined with the detailed metrics, suggests that DNS tunneling might be in use.
Connection Failures to 8.8.8.8:
The repeated connection attempts from the source IP (10.0.1.10) to the destination IP (8.8.8.8) with connection failures can indicate an attempt to communicate with an external server.
Google DNS (8.8.8.8) is often used for DNS tunneling due to its reliability and global reach.
Conclusion:
Given the significant DNS traffic and the nature of the connection attempts, it is reasonable to conclude that DNS tunneling is being used to extract confidential data from the local network.
Why Other Options are Less Likely:
Spearphishing (A): There is no evidence from the provided data that points to spearphishing attempts, such as email logs or phishing indicators.
Reconnaissance (C): The data does not indicate typical reconnaissance activities, such as scanning or probing mail servers.
FTP C&C (D): There is no evidence of FTP traffic or command-and-control communications using FTP in the provided data.
SANS Institute: 'DNS Tunneling: How to Detect Data Exfiltration and Tunneling Through DNS Queries' SANS DNS Tunneling
OWASP: 'DNS Tunneling' OWASP DNS Tunneling
By analyzing the provided threat hunting data, it is evident that DNS tunneling is being used to exfiltrate data, indicating a sophisticated method of extracting confidential information from the network.
Question 3
Refer to Exhibit:

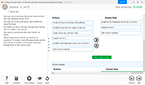
You are tasked with reviewing a new FortiAnalyzer deployment in a network with multiple registered logging devices. There is only one FortiAnalyzer in the topology.
Which potential problem do you observe?
- The disk space allocated is insufficient.
- The analytics-to-archive ratio is misconfigured.
- The analytics retention period is too long.
- The archive retention period is too long.
Correct answer: B
Explanation:
Understanding FortiAnalyzer Data Policy and Disk Utilization:FortiAnalyzer uses data policies to manage log storage, retention, and disk utilization.The Data Policy section indicates how long logs are kept for analytics and archive purposes.The Disk Utilization section specifies the allocated disk space and the proportions used for analytics and archive, as well as when alerts should be triggered based on disk usage.Analyzing the Provided Exhibit:Keep Logs for Analytics: 60 DaysKeep Logs for Archive: 120 DaysDisk Allocation: 300 GB (with a maximum of 441 GB available)Analytics: Archive Ratio: 30% : 70%Alert and Delete When Usage Reaches: 90%Potential Problems Identification:Disk Space Allocation: The allocated disk space is 300 GB out of a possible 441 GB, which might not be insufficient if the log volume is high, but it is not the primary concern based on the given data.Analytics-to-Archive Ratio: The ratio of 30% for analytics and 70% for archive is unconventional. Typically, a higher percentage is allocated for analytics since real-time or recent data analysis is often prioritized. A common configuration might be a 70% analytics and 30% archive ratio. The misconfigured ratio can lead to insufficient space for analytics, causing issues with real-time monitoring and analysis.Retention Periods: While the retention periods could be seen as lengthy, they are not necessarily indicative of a problem without knowing the specific log volume and compliance requirements. The length of these periods can vary based on organizational needs and legal requirements.Conclusion:Based on the analysis, the primary issue observed is the analytics-to-archive ratio being misconfigured. This misconfiguration can significantly impact the effectiveness of the FortiAnalyzer in real-time log analysis, potentially leading to delayed threat detection and response.Fortinet Documentation on FortiAnalyzer Data Policies and Disk Management.Best Practices for FortiAnalyzer Log Management and Disk Utilization. Understanding FortiAnalyzer Data Policy and Disk Utilization:
FortiAnalyzer uses data policies to manage log storage, retention, and disk utilization.
The Data Policy section indicates how long logs are kept for analytics and archive purposes.
The Disk Utilization section specifies the allocated disk space and the proportions used for analytics and archive, as well as when alerts should be triggered based on disk usage.
Analyzing the Provided Exhibit:
Keep Logs for Analytics: 60 Days
Keep Logs for Archive: 120 Days
Disk Allocation: 300 GB (with a maximum of 441 GB available)
Analytics: Archive Ratio: 30% : 70%
Alert and Delete When Usage Reaches: 90%
Potential Problems Identification:
Disk Space Allocation: The allocated disk space is 300 GB out of a possible 441 GB, which might not be insufficient if the log volume is high, but it is not the primary concern based on the given data.
Analytics-to-Archive Ratio: The ratio of 30% for analytics and 70% for archive is unconventional. Typically, a higher percentage is allocated for analytics since real-time or recent data analysis is often prioritized. A common configuration might be a 70% analytics and 30% archive ratio. The misconfigured ratio can lead to insufficient space for analytics, causing issues with real-time monitoring and analysis.
Retention Periods: While the retention periods could be seen as lengthy, they are not necessarily indicative of a problem without knowing the specific log volume and compliance requirements. The length of these periods can vary based on organizational needs and legal requirements.
Conclusion:
Based on the analysis, the primary issue observed is the analytics-to-archive ratio being misconfigured. This misconfiguration can significantly impact the effectiveness of the FortiAnalyzer in real-time log analysis, potentially leading to delayed threat detection and response.
Fortinet Documentation on FortiAnalyzer Data Policies and Disk Management.
Best Practices for FortiAnalyzer Log Management and Disk Utilization.
Question 4
Your company is doing a security audit To pass the audit, you must take an inventory of all software and applications running on all Windows devices
Which FortiAnalyzer connector must you use?
- FortiClient EMS
- ServiceNow
- FortiCASB
- Local Host
Correct answer: A
Explanation:
Requirement Analysis:The objective is to inventory all software and applications running on all Windows devices within the organization.This inventory must be comprehensive and accurate to pass the security audit.Key Components:FortiClient EMS (Endpoint Management Server):FortiClient EMS provides centralized management of endpoint security, including software and application inventory on Windows devices.It allows administrators to monitor, manage, and report on all endpoints protected by FortiClient.Connector Options:FortiClient EMS:Best suited for managing and reporting on endpoint software and applications.Provides detailed inventory reports for all managed endpoints.Selected as it directly addresses the requirement of taking inventory of software and applications on Windows devices.ServiceNow:Primarily a service management platform.While it can be used for asset management, it is not specifically tailored for endpoint software inventory.Not selected as it does not provide direct endpoint inventory management.FortiCASB:Focuses on cloud access security and monitoring SaaS applications.Not applicable for managing or inventorying endpoint software.Not selected as it is not related to endpoint software inventory.Local Host:Refers to handling events and logs within FortiAnalyzer itself.Not specific enough for detailed endpoint software inventory.Not selected as it does not provide the required endpoint inventory capabilities.Implementation Steps:Step 1: Ensure all Windows devices are managed by FortiClient and connected to FortiClient EMS.Step 2: Use FortiClient EMS to collect and report on the software and applications installed on these devices.Step 3: Generate inventory reports from FortiClient EMS to meet the audit requirements.Fortinet Documentation on FortiClient EMS FortiClient EMS Administration GuideBy using the FortiClient EMS connector, you can effectively inventory all software and applications on Windows devices, ensuring compliance with the security audit requirements. Requirement Analysis:
The objective is to inventory all software and applications running on all Windows devices within the organization.
This inventory must be comprehensive and accurate to pass the security audit.
Key Components:
FortiClient EMS (Endpoint Management Server):
FortiClient EMS provides centralized management of endpoint security, including software and application inventory on Windows devices.
It allows administrators to monitor, manage, and report on all endpoints protected by FortiClient.
Connector Options:
FortiClient EMS:
Best suited for managing and reporting on endpoint software and applications.
Provides detailed inventory reports for all managed endpoints.
Selected as it directly addresses the requirement of taking inventory of software and applications on Windows devices.
ServiceNow:
Primarily a service management platform.
While it can be used for asset management, it is not specifically tailored for endpoint software inventory.
Not selected as it does not provide direct endpoint inventory management.
FortiCASB:
Focuses on cloud access security and monitoring SaaS applications.
Not applicable for managing or inventorying endpoint software.
Not selected as it is not related to endpoint software inventory.
Local Host:
Refers to handling events and logs within FortiAnalyzer itself.
Not specific enough for detailed endpoint software inventory.
Not selected as it does not provide the required endpoint inventory capabilities.
Implementation Steps:
Step 1: Ensure all Windows devices are managed by FortiClient and connected to FortiClient EMS.
Step 2: Use FortiClient EMS to collect and report on the software and applications installed on these devices.
Step 3: Generate inventory reports from FortiClient EMS to meet the audit requirements.
Fortinet Documentation on FortiClient EMS FortiClient EMS Administration Guide
By using the FortiClient EMS connector, you can effectively inventory all software and applications on Windows devices, ensuring compliance with the security audit requirements.
Question 5
Which two playbook triggers enable the use of trigger events in later tasks as trigger variables? (Choose two.)
- EVENT
- INCIDENT
- ON SCHEDULE
- ON DEMAND
Correct answer: AB
Explanation:
Understanding Playbook Triggers:Playbook triggers are the starting points for automated workflows within FortiAnalyzer or FortiSOAR.These triggers determine how and when a playbook is executed and can pass relevant information (trigger variables) to subsequent tasks within the playbook.Types of Playbook Triggers:EVENT Trigger:Initiates the playbook when a specific event occurs.The event details can be used as variables in later tasks to customize the response.Selected as it allows using event details as trigger variables.INCIDENT Trigger:Activates the playbook when an incident is created or updated.The incident details are available as variables in subsequent tasks.Selected as it enables the use of incident details as trigger variables.ON SCHEDULE Trigger:Executes the playbook at specified times or intervals.Does not inherently use trigger events to pass variables to later tasks.Not selected as it does not involve passing trigger event details.ON DEMAND Trigger:Runs the playbook manually or as required.Does not automatically include trigger event details for use in later tasks.Not selected as it does not use trigger events for variables.Implementation Steps:Step 1: Define the conditions for the EVENT or INCIDENT trigger in the playbook configuration.Step 2: Use the details from the trigger event or incident in subsequent tasks to customize actions and responses.Step 3: Test the playbook to ensure that the trigger variables are correctly passed and utilized.Conclusion:EVENT and INCIDENT triggers are specifically designed to initiate playbooks based on specific occurrences, allowing the use of trigger details in subsequent tasks.Fortinet Documentation on Playbook Configuration FortiSOAR Playbook GuideBy using the EVENT and INCIDENT triggers, you can leverage trigger events in later tasks as variables, enabling more dynamic and responsive playbook actions. Understanding Playbook Triggers:
Playbook triggers are the starting points for automated workflows within FortiAnalyzer or FortiSOAR.
These triggers determine how and when a playbook is executed and can pass relevant information (trigger variables) to subsequent tasks within the playbook.
Types of Playbook Triggers:
EVENT Trigger:
Initiates the playbook when a specific event occurs.
The event details can be used as variables in later tasks to customize the response.
Selected as it allows using event details as trigger variables.
INCIDENT Trigger:
Activates the playbook when an incident is created or updated.
The incident details are available as variables in subsequent tasks.
Selected as it enables the use of incident details as trigger variables.
ON SCHEDULE Trigger:
Executes the playbook at specified times or intervals.
Does not inherently use trigger events to pass variables to later tasks.
Not selected as it does not involve passing trigger event details.
ON DEMAND Trigger:
Runs the playbook manually or as required.
Does not automatically include trigger event details for use in later tasks.
Not selected as it does not use trigger events for variables.
Implementation Steps:
Step 1: Define the conditions for the EVENT or INCIDENT trigger in the playbook configuration.
Step 2: Use the details from the trigger event or incident in subsequent tasks to customize actions and responses.
Step 3: Test the playbook to ensure that the trigger variables are correctly passed and utilized.
Conclusion:
EVENT and INCIDENT triggers are specifically designed to initiate playbooks based on specific occurrences, allowing the use of trigger details in subsequent tasks.
Fortinet Documentation on Playbook Configuration FortiSOAR Playbook Guide
By using the EVENT and INCIDENT triggers, you can leverage trigger events in later tasks as variables, enabling more dynamic and responsive playbook actions.
Question 6
Refer to the exhibit.

You notice that the custom event handler you configured to detect SMTP reconnaissance activities is creating a large number of events. This is overwhelming your notification system.
How can you fix this?
- Increase the trigger count so that it identifies and reduces the count triggered by a particular group.
- Disable the custom event handler because it is not working as expected.
- Decrease the time range that the custom event handler covers during the attack.
- Increase the log field value so that it looks for more unique field values when it creates the event.
Correct answer: A
Explanation:
Understanding the Issue:The custom event handler for detecting SMTP reconnaissance activities is generating a large number of events.This high volume of events is overwhelming the notification system, leading to potential alert fatigue and inefficiency in incident response.Event Handler Configuration:Event handlers are configured to trigger alerts based on specific criteria.The frequency and volume of these alerts can be controlled by adjusting the trigger conditions.Possible Solutions:A . Increase the trigger count so that it identifies and reduces the count triggered by a particular group:By increasing the trigger count, you ensure that the event handler only generates alerts after a higher threshold of activity is detected.This reduces the number of events generated and helps prevent overwhelming the notification system.Selected as it effectively manages the volume of generated events.B . Disable the custom event handler because it is not working as expected:Disabling the event handler is not a practical solution as it would completely stop monitoring for SMTP reconnaissance activities.Not selected as it does not address the issue of fine-tuning the event generation. C . Decrease the time range that the custom event handler covers during the attack:Reducing the time range might help in some cases, but it could also lead to missing important activities if the attack spans a longer period.Not selected as it could lead to underreporting of significant events.D . Increase the log field value so that it looks for more unique field values when it creates the event:Adjusting the log field value might refine the event criteria, but it does not directly control the volume of alerts.Not selected as it is not the most effective way to manage event volume.Implementation Steps:Step 1: Access the event handler configuration in FortiAnalyzer.Step 2: Locate the trigger count setting within the custom event handler for SMTP reconnaissance.Step 3: Increase the trigger count to a higher value that balances alert sensitivity and volume.Step 4: Save the configuration and monitor the event generation to ensure it aligns with expected levels.Conclusion:By increasing the trigger count, you can effectively reduce the number of events generated by the custom event handler, preventing the notification system from being overwhelmed.Fortinet Documentation on Event Handlers and Configuration FortiAnalyzer Administration GuideBest Practices for Event Management Fortinet Knowledge BaseBy increasing the trigger count in the custom event handler, you can manage the volume of generated events and prevent the notification system from being overwhelmed. Understanding the Issue:
The custom event handler for detecting SMTP reconnaissance activities is generating a large number of events.
This high volume of events is overwhelming the notification system, leading to potential alert fatigue and inefficiency in incident response.
Event Handler Configuration:
Event handlers are configured to trigger alerts based on specific criteria.
The frequency and volume of these alerts can be controlled by adjusting the trigger conditions.
Possible Solutions:
A . Increase the trigger count so that it identifies and reduces the count triggered by a particular group:
By increasing the trigger count, you ensure that the event handler only generates alerts after a higher threshold of activity is detected.
This reduces the number of events generated and helps prevent overwhelming the notification system.
Selected as it effectively manages the volume of generated events.
B . Disable the custom event handler because it is not working as expected:
Disabling the event handler is not a practical solution as it would completely stop monitoring for SMTP reconnaissance activities.
Not selected as it does not address the issue of fine-tuning the event generation.
C . Decrease the time range that the custom event handler covers during the attack:
Reducing the time range might help in some cases, but it could also lead to missing important activities if the attack spans a longer period.
Not selected as it could lead to underreporting of significant events.
D . Increase the log field value so that it looks for more unique field values when it creates the event:
Adjusting the log field value might refine the event criteria, but it does not directly control the volume of alerts.
Not selected as it is not the most effective way to manage event volume.
Implementation Steps:
Step 1: Access the event handler configuration in FortiAnalyzer.
Step 2: Locate the trigger count setting within the custom event handler for SMTP reconnaissance.
Step 3: Increase the trigger count to a higher value that balances alert sensitivity and volume.
Step 4: Save the configuration and monitor the event generation to ensure it aligns with expected levels.
Conclusion:
By increasing the trigger count, you can effectively reduce the number of events generated by the custom event handler, preventing the notification system from being overwhelmed.
Fortinet Documentation on Event Handlers and Configuration FortiAnalyzer Administration Guide
Best Practices for Event Management Fortinet Knowledge Base
By increasing the trigger count in the custom event handler, you can manage the volume of generated events and prevent the notification system from being overwhelmed.
Question 7
Which statement best describes the MITRE ATT&CK framework?
- It provides a high-level description of common adversary activities, but lacks technical details
- It covers tactics, techniques, and procedures, but does not provide information about mitigations.
- It describes attack vectors targeting network devices and servers, but not user endpoints.
- It contains some techniques or subtechniques that fall under more than one tactic.
Correct answer: D
Explanation:
Understanding the MITRE ATT&CK Framework:The MITRE ATT&CK framework is a comprehensive matrix of tactics and techniques used by adversaries to achieve their objectives.It is widely used for understanding adversary behavior, improving defense strategies, and conducting security assessments.Analyzing the Options:Option A: The framework provides detailed technical descriptions of adversary activities, including specific techniques and subtechniques.Option B: The framework includes information about mitigations and detections for each technique and subtechnique, providing comprehensive guidance.Option C: MITRE ATT&CK covers a wide range of attack vectors, including those targeting user endpoints, network devices, and servers.Option D: Some techniques or subtechniques do indeed fall under multiple tactics, reflecting the complex nature of adversary activities that can serve different objectives.Conclusion:The statement that best describes the MITRE ATT&CK framework is that it contains some techniques or subtechniques that fall under more than one tactic.MITRE ATT&CK Framework Documentation.Security Best Practices and Threat Intelligence Reports Utilizing MITRE ATT&CK. Understanding the MITRE ATT&CK Framework:
The MITRE ATT&CK framework is a comprehensive matrix of tactics and techniques used by adversaries to achieve their objectives.
It is widely used for understanding adversary behavior, improving defense strategies, and conducting security assessments.
Analyzing the Options:
Option A: The framework provides detailed technical descriptions of adversary activities, including specific techniques and subtechniques.
Option B: The framework includes information about mitigations and detections for each technique and subtechnique, providing comprehensive guidance.
Option C: MITRE ATT&CK covers a wide range of attack vectors, including those targeting user endpoints, network devices, and servers.
Option D: Some techniques or subtechniques do indeed fall under multiple tactics, reflecting the complex nature of adversary activities that can serve different objectives.
Conclusion:
The statement that best describes the MITRE ATT&CK framework is that it contains some techniques or subtechniques that fall under more than one tactic.
MITRE ATT&CK Framework Documentation.
Security Best Practices and Threat Intelligence Reports Utilizing MITRE ATT&CK.
Question 8
Exhibit:

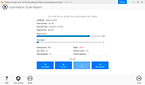
Which observation about this FortiAnalyzer Fabric deployment architecture is true?
- The AMER HQ SOC team cannot run automation playbooks from the Fabric supervisor.
- The AMER HQ SOC team must configure high availability (HA) for the supervisor node.
- The EMEA SOC team has access to historical logs only.
- The APAC SOC team has access to FortiView and other reporting functions.
Correct answer: A
Explanation:
Understanding FortiAnalyzer Fabric Deployment:FortiAnalyzer Fabric deployment involves a hierarchical structure where the Fabric root (supervisor) coordinates with multiple Fabric members (collectors and analyzers).This setup ensures centralized log collection, analysis, and incident response across geographically distributed locations.Analyzing the Exhibit:FAZ1-Supervisor is located at AMER HQ and acts as the Fabric root.FAZ2-Analyzer is a Fabric member located in EMEA.FAZ3-Collector and FAZ4-Collector are Fabric members located in EMEA and APAC, respectively.Evaluating the Options:Option A: The statement indicates that the AMER HQ SOC team cannot run automation playbooks from the Fabric supervisor. This is true because automation playbooks and certain orchestration tasks typically require local execution capabilities which may not be fully supported on the supervisor node.Option B: High availability (HA) configuration for the supervisor node is a best practice for redundancy but is not directly inferred from the given architecture.Option C: The EMEA SOC team having access to historical logs only is not correct since FAZ2-Analyzer provides full analysis capabilities.Option D: The APAC SOC team has access to FortiView and other reporting functions through FAZ4-Collector, but this is not explicitly detailed in the provided architecture.Conclusion:The most accurate observation about this FortiAnalyzer Fabric deployment architecture is that the AMER HQ SOC team cannot run automation playbooks from the Fabric supervisor.Fortinet Documentation on FortiAnalyzer Fabric Deployment.Best Practices for FortiAnalyzer and Automation Playbooks. Understanding FortiAnalyzer Fabric Deployment:
FortiAnalyzer Fabric deployment involves a hierarchical structure where the Fabric root (supervisor) coordinates with multiple Fabric members (collectors and analyzers).
This setup ensures centralized log collection, analysis, and incident response across geographically distributed locations.
Analyzing the Exhibit:
FAZ1-Supervisor is located at AMER HQ and acts as the Fabric root.
FAZ2-Analyzer is a Fabric member located in EMEA.
FAZ3-Collector and FAZ4-Collector are Fabric members located in EMEA and APAC, respectively.
Evaluating the Options:
Option A: The statement indicates that the AMER HQ SOC team cannot run automation playbooks from the Fabric supervisor. This is true because automation playbooks and certain orchestration tasks typically require local execution capabilities which may not be fully supported on the supervisor node.
Option B: High availability (HA) configuration for the supervisor node is a best practice for redundancy but is not directly inferred from the given architecture.
Option C: The EMEA SOC team having access to historical logs only is not correct since FAZ2-Analyzer provides full analysis capabilities.
Option D: The APAC SOC team has access to FortiView and other reporting functions through FAZ4-Collector, but this is not explicitly detailed in the provided architecture.
Conclusion:
The most accurate observation about this FortiAnalyzer Fabric deployment architecture is that the AMER HQ SOC team cannot run automation playbooks from the Fabric supervisor.
Fortinet Documentation on FortiAnalyzer Fabric Deployment.
Best Practices for FortiAnalyzer and Automation Playbooks.
Question 9
When configuring a FortiAnalyzer to act as a collector device, which two steps must you perform? (Choose two.)
- Enable log compression.
- Configure log forwarding to a FortiAnalyzer in analyzer mode.
- Configure the data policy to focus on archiving.
- Configure Fabric authorization on the connecting interface.
Correct answer: BD
Explanation:
Understanding FortiAnalyzer Roles:FortiAnalyzer can operate in two primary modes: collector mode and analyzer mode.Collector Mode: Gathers logs from various devices and forwards them to another FortiAnalyzer operating in analyzer mode for detailed analysis.Analyzer Mode: Provides detailed log analysis, reporting, and incident management.Steps to Configure FortiAnalyzer as a Collector Device:A . Enable Log Compression:While enabling log compression can help save storage space, it is not a mandatory step specifically required for configuring FortiAnalyzer in collector mode.Not selected as it is optional and not directly related to the collector configuration process.B . Configure Log Forwarding to a FortiAnalyzer in Analyzer Mode:Essential for ensuring that logs collected by the collector FortiAnalyzer are sent to the analyzer FortiAnalyzer for detailed processing.Selected as it is a critical step in configuring a FortiAnalyzer as a collector device.Step 1: Access the FortiAnalyzer interface and navigate to log forwarding settings.Step 2: Configure log forwarding by specifying the IP address and necessary credentials of the FortiAnalyzer in analyzer mode.C . Configure the Data Policy to Focus on Archiving:Data policy configuration typically relates to how logs are stored and managed within FortiAnalyzer, focusing on archiving may not be specifically required for a collector device setup.Not selected as it is not a necessary step for configuring the collector mode.D . Configure Fabric Authorization on the Connecting Interface:Necessary to ensure secure and authenticated communication between FortiAnalyzer devices within the Security Fabric.Selected as it is essential for secure integration and communication.Step 1: Access the FortiAnalyzer interface and navigate to the Fabric authorization settings.Step 2: Enable Fabric authorization on the interface used for connecting to other Fortinet devices and FortiAnalyzers.Implementation Summary:Configure log forwarding to ensure logs collected are sent to the analyzer.Enable Fabric authorization to ensure secure communication and integration within the Security Fabric.Conclusion:Configuring log forwarding and Fabric authorization are key steps in setting up a FortiAnalyzer as a collector device to ensure proper log collection and forwarding for analysis.Fortinet Documentation on FortiAnalyzer Roles and Configurations FortiAnalyzer Administration GuideBy configuring log forwarding to a FortiAnalyzer in analyzer mode and enabling Fabric authorization on the connecting interface, you can ensure proper setup of FortiAnalyzer as a collector device. Understanding FortiAnalyzer Roles:
FortiAnalyzer can operate in two primary modes: collector mode and analyzer mode.
Collector Mode: Gathers logs from various devices and forwards them to another FortiAnalyzer operating in analyzer mode for detailed analysis.
Analyzer Mode: Provides detailed log analysis, reporting, and incident management.
Steps to Configure FortiAnalyzer as a Collector Device:
A . Enable Log Compression:
While enabling log compression can help save storage space, it is not a mandatory step specifically required for configuring FortiAnalyzer in collector mode.
Not selected as it is optional and not directly related to the collector configuration process.
B . Configure Log Forwarding to a FortiAnalyzer in Analyzer Mode:
Essential for ensuring that logs collected by the collector FortiAnalyzer are sent to the analyzer FortiAnalyzer for detailed processing.
Selected as it is a critical step in configuring a FortiAnalyzer as a collector device.
Step 1: Access the FortiAnalyzer interface and navigate to log forwarding settings.
Step 2: Configure log forwarding by specifying the IP address and necessary credentials of the FortiAnalyzer in analyzer mode.
C . Configure the Data Policy to Focus on Archiving:
Data policy configuration typically relates to how logs are stored and managed within FortiAnalyzer, focusing on archiving may not be specifically required for a collector device setup.
Not selected as it is not a necessary step for configuring the collector mode.
D . Configure Fabric Authorization on the Connecting Interface:
Necessary to ensure secure and authenticated communication between FortiAnalyzer devices within the Security Fabric.
Selected as it is essential for secure integration and communication.
Step 1: Access the FortiAnalyzer interface and navigate to the Fabric authorization settings.
Step 2: Enable Fabric authorization on the interface used for connecting to other Fortinet devices and FortiAnalyzers.
Implementation Summary:
Configure log forwarding to ensure logs collected are sent to the analyzer.
Enable Fabric authorization to ensure secure communication and integration within the Security Fabric.
Conclusion:
Configuring log forwarding and Fabric authorization are key steps in setting up a FortiAnalyzer as a collector device to ensure proper log collection and forwarding for analysis.
Fortinet Documentation on FortiAnalyzer Roles and Configurations FortiAnalyzer Administration Guide
By configuring log forwarding to a FortiAnalyzer in analyzer mode and enabling Fabric authorization on the connecting interface, you can ensure proper setup of FortiAnalyzer as a collector device.
Question 10
Which statement describes automation stitch integration between FortiGate and FortiAnalyzer?
- An event handler on FortiAnalyzer executes an automation stitch when an event is created.
- An automation stitch is configured on FortiAnalyzer and mapped to FortiGate using the FortiOS connector.
- An event handler on FortiAnalyzer is configured to send a notification to FortiGate to trigger an automation stitch.
- A security profile on FortiGate triggers a violation and FortiGate sends a webhook call to FortiAnalyzer.
Correct answer: D
Explanation:
Overview of Automation Stitches: Automation stitches in Fortinet solutions enable automated responses to specific events detected within the network. This automation helps in swiftly mitigating threats without manual intervention.FortiGate Security Profiles:FortiGate uses security profiles to enforce policies on network traffic. These profiles can include antivirus, web filtering, intrusion prevention, and more.When a security profile detects a violation or a specific event, it can trigger predefined actions.Webhook Calls:FortiGate can be configured to send webhook calls upon detecting specific security events.A webhook is an HTTP callback triggered by an event, sending data to a specified URL. This allows FortiGate to communicate with other systems, such as FortiAnalyzer.FortiAnalyzer Integration:FortiAnalyzer collects logs and events from various Fortinet devices, providing centralized logging and analysis.Upon receiving a webhook call from FortiGate, FortiAnalyzer can further analyze the event, generate reports, and take automated actions if configured to do so.Detailed Process:Step 1: A security profile on FortiGate triggers a violation based on the defined security policies.Step 2: FortiGate sends a webhook call to FortiAnalyzer with details of the violation.Step 3: FortiAnalyzer receives the webhook call and logs the event.Step 4: Depending on the configuration, FortiAnalyzer can execute an automation stitch to respond to the event, such as sending alerts, generating reports, or triggering further actions.Fortinet Documentation: FortiOS Automation StitchesFortiAnalyzer Administration Guide: Details on configuring event handlers and integrating with FortiGate.FortiGate Administration Guide: Information on security profiles and webhook configurations.By understanding the interaction between FortiGate and FortiAnalyzer through webhook calls and automation stitches, security operations can ensure a proactive and efficient response to security events. Overview of Automation Stitches: Automation stitches in Fortinet solutions enable automated responses to specific events detected within the network. This automation helps in swiftly mitigating threats without manual intervention.
FortiGate Security Profiles:
FortiGate uses security profiles to enforce policies on network traffic. These profiles can include antivirus, web filtering, intrusion prevention, and more.
When a security profile detects a violation or a specific event, it can trigger predefined actions.
Webhook Calls:
FortiGate can be configured to send webhook calls upon detecting specific security events.
A webhook is an HTTP callback triggered by an event, sending data to a specified URL. This allows FortiGate to communicate with other systems, such as FortiAnalyzer.
FortiAnalyzer Integration:
FortiAnalyzer collects logs and events from various Fortinet devices, providing centralized logging and analysis.
Upon receiving a webhook call from FortiGate, FortiAnalyzer can further analyze the event, generate reports, and take automated actions if configured to do so.
Detailed Process:
Step 1: A security profile on FortiGate triggers a violation based on the defined security policies.
Step 2: FortiGate sends a webhook call to FortiAnalyzer with details of the violation.
Step 3: FortiAnalyzer receives the webhook call and logs the event.
Step 4: Depending on the configuration, FortiAnalyzer can execute an automation stitch to respond to the event, such as sending alerts, generating reports, or triggering further actions.
Fortinet Documentation: FortiOS Automation Stitches
FortiAnalyzer Administration Guide: Details on configuring event handlers and integrating with FortiGate.
FortiGate Administration Guide: Information on security profiles and webhook configurations.
By understanding the interaction between FortiGate and FortiAnalyzer through webhook calls and automation stitches, security operations can ensure a proactive and efficient response to security events.
Question 11
Refer to Exhibit:

A SOC analyst is creating the Malicious File Detected playbook to run when FortiAnalyzer generates a malicious file event. The playbook must also update the incident with the malicious file event data.
What must the next task in this playbook be?
- A local connector with the action Update Asset and Identity
- A local connector with the action Attach Data to Incident
- A local connector with the action Run Report
- A local connector with the action Update Incident
Correct answer: D
Explanation:
Understanding the Playbook and its Components:The exhibit shows a playbook in which an event trigger starts actions upon detecting a malicious file.The initial tasks in the playbook include CREATE_INCIDENT and GET_EVENTS.Analysis of Current Tasks:EVENT_TRIGGER STARTER: This initiates the playbook when a specified event (malicious file detection) occurs.CREATE_INCIDENT: This task likely creates a new incident in the incident management system for tracking and response.GET_EVENTS: This task retrieves the event details related to the detected malicious file.Objective of the Next Task:The next logical step after creating an incident and retrieving event details is to update the incident with the event data, ensuring all relevant information is attached to the incident record.This helps SOC analysts by consolidating all pertinent details within the incident record, facilitating efficient tracking and response.Evaluating the Options:Option A: Update Asset and Identity is not directly relevant to attaching event data to the incident.Option B: Attach Data to Incident sounds plausible but typically, updating an incident involves more comprehensive changes including status updates, adding comments, and other data modifications.Option C: Run Report is irrelevant in this context as the goal is to update the incident with event data.Option D: Update Incident is the most suitable action for incorporating event data into the existing incident record.Conclusion:The next task in the playbook should be to update the incident with the event data to ensure the incident reflects all necessary information for further investigation and response.Fortinet Documentation on Playbook Creation and Incident Management.Best Practices for Automating Incident Response in SOC Operations. Understanding the Playbook and its Components:
The exhibit shows a playbook in which an event trigger starts actions upon detecting a malicious file.
The initial tasks in the playbook include CREATE_INCIDENT and GET_EVENTS.
Analysis of Current Tasks:
EVENT_TRIGGER STARTER: This initiates the playbook when a specified event (malicious file detection) occurs.
CREATE_INCIDENT: This task likely creates a new incident in the incident management system for tracking and response.
GET_EVENTS: This task retrieves the event details related to the detected malicious file.
Objective of the Next Task:
The next logical step after creating an incident and retrieving event details is to update the incident with the event data, ensuring all relevant information is attached to the incident record.
This helps SOC analysts by consolidating all pertinent details within the incident record, facilitating efficient tracking and response.
Evaluating the Options:
Option A: Update Asset and Identity is not directly relevant to attaching event data to the incident.
Option B: Attach Data to Incident sounds plausible but typically, updating an incident involves more comprehensive changes including status updates, adding comments, and other data modifications.
Option C: Run Report is irrelevant in this context as the goal is to update the incident with event data.
Option D: Update Incident is the most suitable action for incorporating event data into the existing incident record.
Conclusion:
The next task in the playbook should be to update the incident with the event data to ensure the incident reflects all necessary information for further investigation and response.
Fortinet Documentation on Playbook Creation and Incident Management.
Best Practices for Automating Incident Response in SOC Operations.
HOW TO OPEN VCE FILES
Use VCE Exam Simulator to open VCE files
HOW TO OPEN VCEX AND EXAM FILES
Use ProfExam Simulator to open VCEX and EXAM files
ProfExam at a 20% markdown
You have the opportunity to purchase ProfExam at a 20% reduced price
Get Now!